

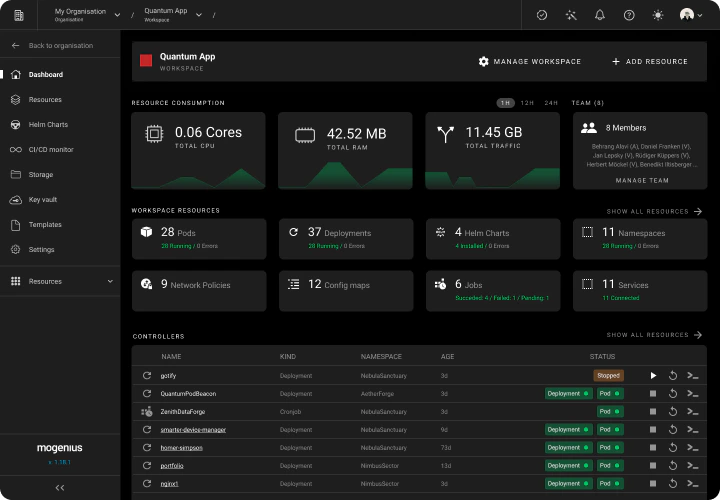
- Monitor resource consumption and filter by time ranges.
- See team activity on the workspace.
- Identify issues and events from Kubernetes workloads.
Customizing workspace dashboards
The layout of the workspace dashboard is not fixed. Cluster administrators can define custom dashboards that control which sections appear and add tailored resource tables — so each team can get a landing view that fits how they work. A single dashboard can be shared across multiple workspaces. Workspaces that aren’t assigned a custom dashboard use the built-in default dashboard, which shows all standard sections.Configuring a dashboard
Custom dashboards are managed by cluster administrators.- Open your Cluster and go to Settings → Workspace Dashboards.
- Edit the default dashboard, or create a new named dashboard.
- Toggle the built-in sections and add resource tables (see below).
- Assign the dashboard to one or more workspaces. A live preview shows the resulting layout as you edit.
Built-in sections
Each of these standard sections can be turned on or off:- Dashboard header — the workspace summary at the top of the page.
- Capacities — the resource-consumption tile.
- Agents — the banner surfacing AI agent findings and proposals for the workspace.
- Members — the workspace members tile.
- Resource overview — the standard overview of workspace resources.